Echarts图表与SpringBoot数据传输。
ECharts是一款基于JavaScript 的数据可视化 图表库,提供直观,生动,可交互,可个性化定制的数据可视化图表。ECharts最初由百度 团队开源,并于2018年初捐赠给Apache 基金会,成为ASF 孵化级项目。
https://echarts.apache.org/zh/index.html
Echarts获取途径
点击下载Echarts压缩包:echarts-5.4.2.tgz
1 2 3 4 5 6 <head > <meta charset ="utf-8" > <title > 第一个 ECharts 实例</title > <script src ="https://cdn.staticfile.org/echarts/4.3.0/echarts.min.js" > </script > </head >
纯前端-快速入门
CDN导入Echarts.js
1 2 <script src ="layui/echarts.js" > </script >
前端为Echarts准备容器
1 2 <div id ="main" style ="width: 600px;height:400px;" > </div >
js创建图表实例echarts
1 2 var myChart = echarts.init (document .getElementById ('main' ));
创建配置对象option
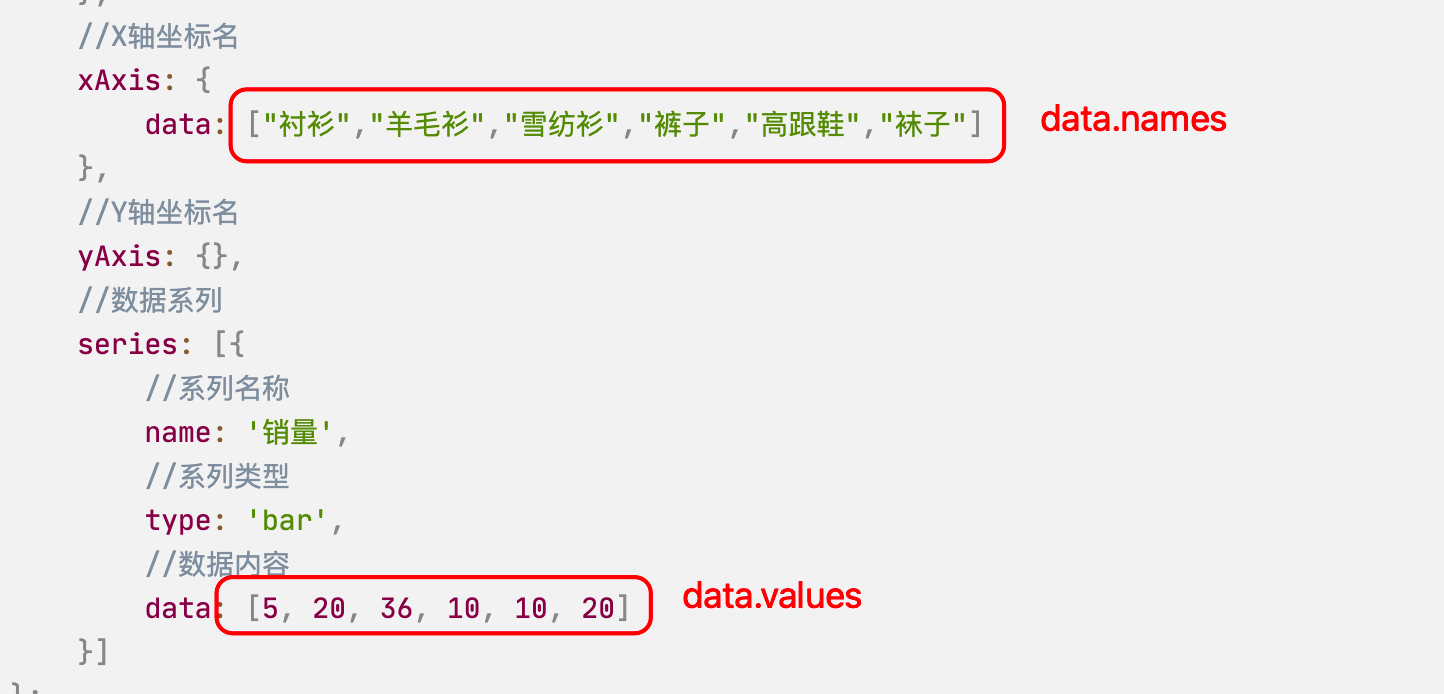
1 2 3 4 5 6 7 8 9 10 11 12 13 14 15 16 17 18 19 var option = {title : {text : '第一个 ECharts 实例' tooltip : {},legend : {data :['销量' ]xAxis : {data : ["衬衫" ,"羊毛衫" ,"雪纺衫" ,"裤子" ,"高跟鞋" ,"袜子" ]yAxis : {},series : [{name : '销量' ,type : 'bar' ,data : [5 , 20 , 36 , 10 , 10 , 20 ]
将option传入echarts
1 2 setOption (option);
完整代码
1
2
3
4
5
6
7
8
9
10
11
12
13
14
15
16
17
18
19
20
21
22
23
24
25
26
27
28
29
30
31
32
33
34
35
36
37
38
39
40
41
42
43
44
<!DOCTYPE html > <html > <head > <meta charset ="utf-8" > <title > ECharts 实例</title > <script src ="layui/echarts.js" > </script > </head > <body > <div id ="main" style ="width: 600px;height:400px;" > </div > <script type ="text/javascript" > var myChart = echarts.init (document .getElementById ('main' )); var option = { title : { text : '第一个 ECharts 实例' }, tooltip : {}, legend : { data :['销量' ] }, xAxis : { data : ["衬衫" ,"羊毛衫" ,"雪纺衫" ,"裤子" ,"高跟鞋" ,"袜子" ] }, yAxis : {}, series : [{ name : '销量' , type : 'bar' , data : [5 , 20 , 36 , 10 , 10 , 20 ] }] }; myChart.setOption (option); </script > </body > </html >
图表样式 官网示例:
https://echarts.apache.org/examples/zh/index.html#chart-type-line
Option配置详情
英文
汉语
title
标题
tooltip
提示
legend
图例
xAxis
x轴线
yAxis
y轴线
series
系列
- data
数据
1 2 3 4 5 6 7 8 9 10 11 12 13 14 15 16 17 18 19 20 21 22 23 24 25 26 27 28 29 var option = {title : {text : '第一个 ECharts 实例' tooltip : {},legend : {data :['销量' ]xAxis : {data : ["衬衫" ,"羊毛衫" ,"雪纺衫" ,"裤子" ,"高跟鞋" ,"袜子" ]yAxis : {},series : [{name : '销量' ,type : 'bar' ,data : [5 , 20 , 36 , 10 , 10 , 20 ]
后端给前端传输数据 之前我们都是使用前端设置的固定数据,来决定图表的数据。这次我们决定让前端向后端发起请求,由后端将数据传送回前端。
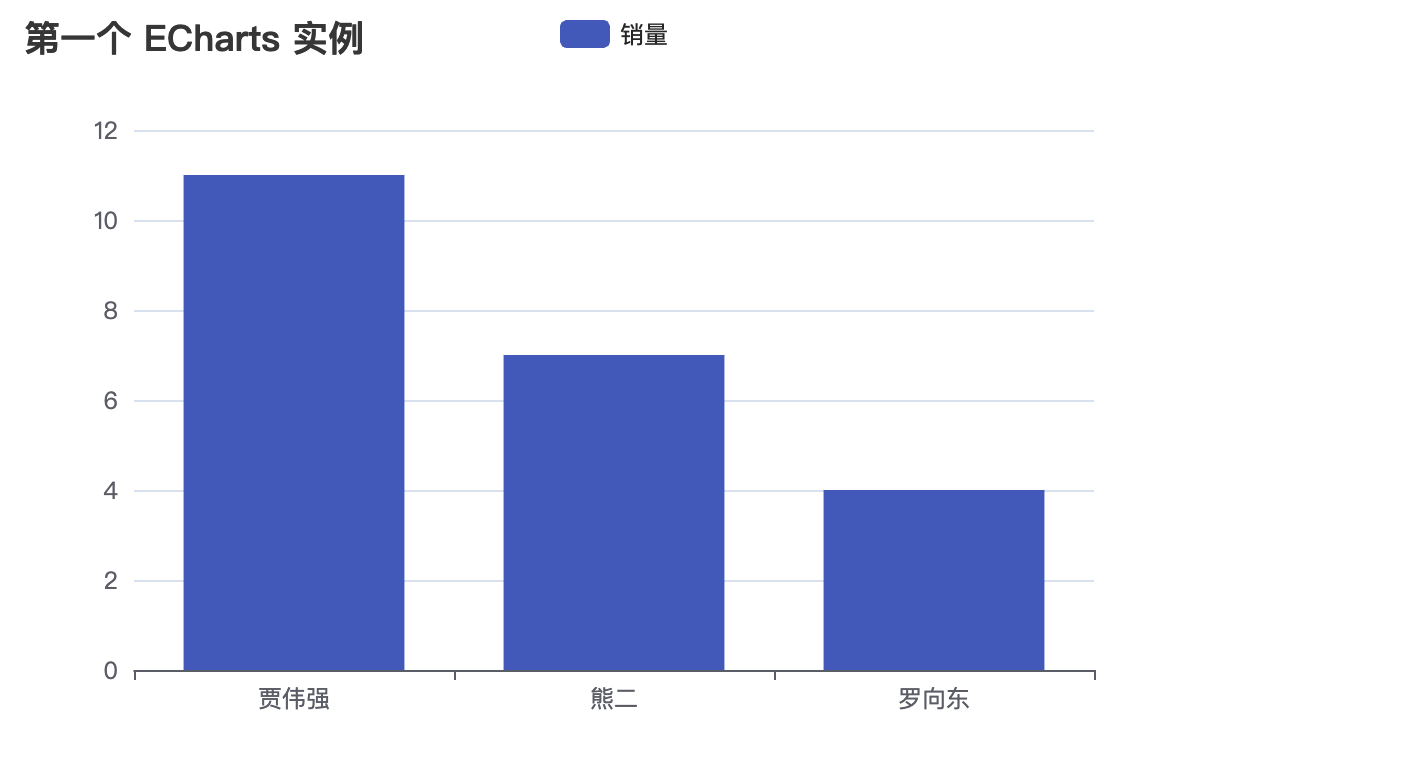
需求:数据库表中有很多重名的诗人(Poet):熊二,贾伟强,汤文龙,罗向东。我们需要通过Echarts图表来统计出每一个人的数量。
1
2
3
4
5
6
7
8
@Data public class BarVo {
PoetBarVo,用来接收username和count的Map关系
1
2
3
4
5
@Data public class PoetBarVo {
1
2
3
4
5
6
7
8
9
10
11
@Data public class Poet {
1
2
3
4
5
6
7
8
9
@Mapper public interface PoetMapper extends BaseMapper <Poet> {@Select("SELECT username , count(*) as count FROM poet GROUP BY username ORDER BY COUNT(*) DESC") findAllPoetBarVo () ;
Service,将我们横向结构的PoetBarVo转化成纵向结构的BarVo
1
2
3
4
5
6
7
8
9
10
11
12
13
14
15
16
17
18
19
@Override public BarVo getBarVo () {new ArrayList <>();new ArrayList <>();for (PoetBarVo poetBarVo : list){BarVo barVo = new BarVo ();return barVo;
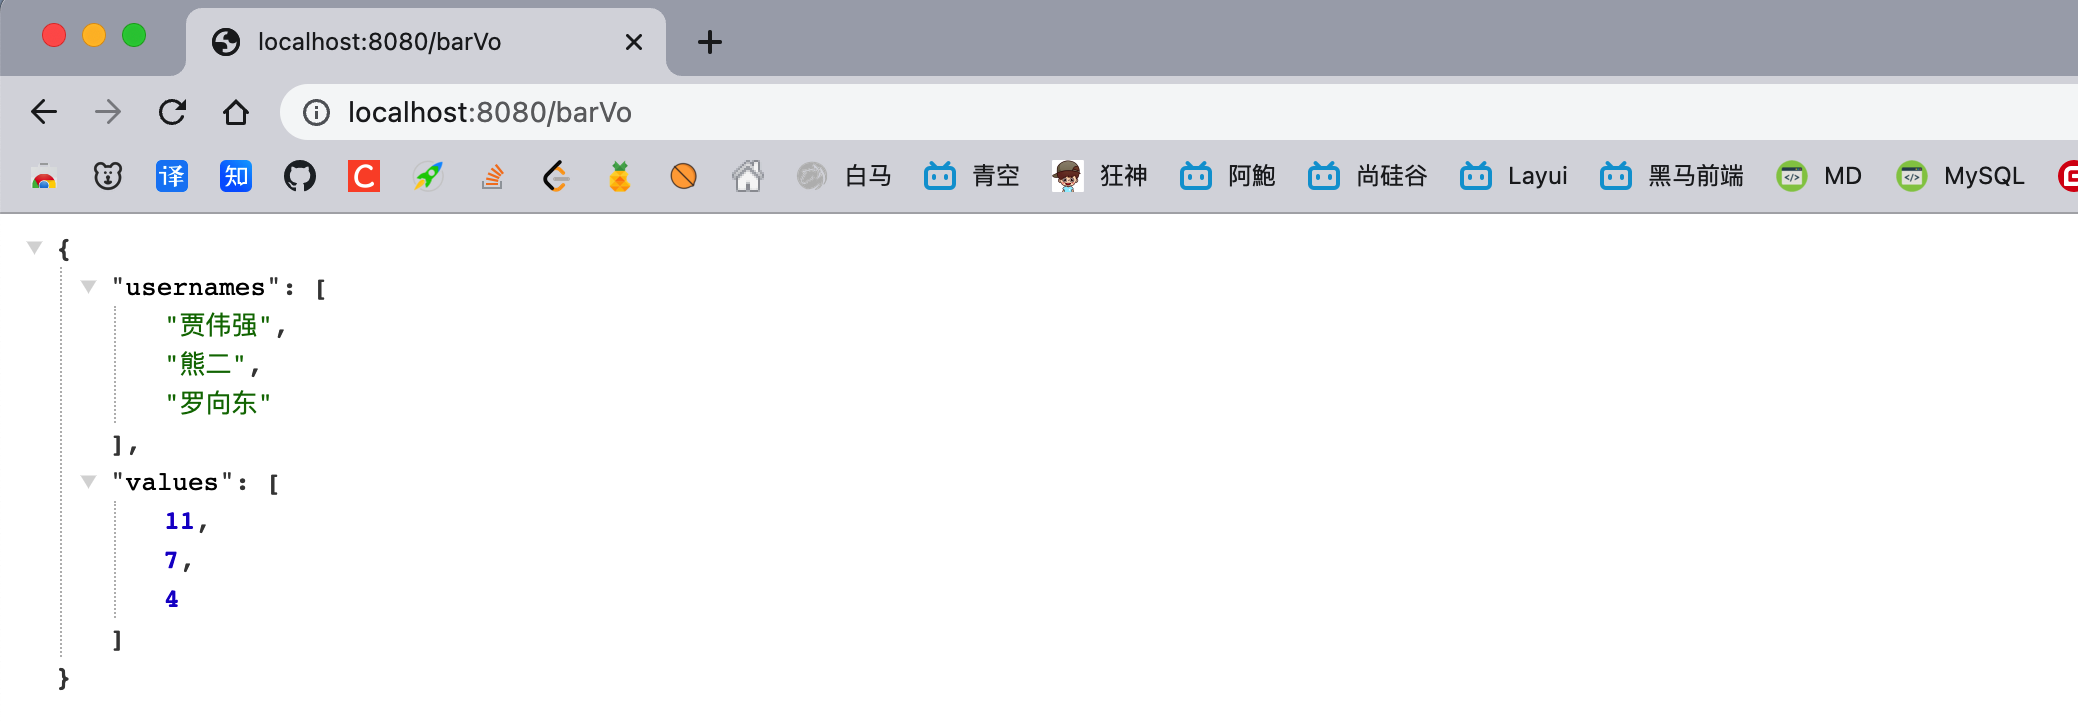
1
2
3
4
5
@RequestMapping("/barVo") public BarVo getBarVo () {BarVo barVo = service.getBarVo();return barVo;
前端代码(添加jQuery-CDN,将图表全部代码放到ajax的success属性下)
1
2
3
4
5
6
7
8
9
10
11
12
13
14
15
16
17
18
19
20
21
22
23
24
25
26
27
28
29
30
31
32
33
34
35
36
37
38
39
40
41
42
43
44
45
46
47
48
49
50
51
52
53
<!DOCTYPE html > <html > <head > <meta charset ="utf-8" > <title > ECharts 实例</title > <script src ="layui/echarts.js" > </script > <script src ="//code.jquery.com/jquery-1.11.3.min.js" > </script > </head > <body > <div id ="main" style ="width: 600px;height:400px;" > </div > <script type ="text/javascript" > $(function ( $.ajax ({ "url" :"http://localhost:8080/barVo" , "type" :"POST" , "success" :function (data ){ var myChart = echarts.init (document .getElementById ('main' )); var option = { title : { text : '第一个 ECharts 实例' }, tooltip : {}, legend : { data :['销量' ] }, xAxis : { data : data.usernames }, yAxis : {}, series : [{ name : '销量' , type : 'bar' , data : data.values }] }; myChart.setOption (option); } }) }) </script > </body > </html >